Frontend Alerting and an AI-Assisted Triage Bot
Relative-change alerting on telemetry plus an LLM-assisted chat bot that turns an alert into a probable root cause, in the thread where the team already works.
- Stack
- SQL · Alerting service · LLM API · Kubernetes · Internal chat bot
The problem
Silent drop-offs during third-party handoffs were found days later through customer support. The alerts were threshold-based and noisy, so people had learned to ignore them.
The approach
- Relative baselines, not static thresholds. The alerting service runs SQL against the telemetry store and compares each metric with the same hour last week. A 20% drop means something at 3 a.m. in one region and at noon in another, and global traffic swings stop causing false alarms.
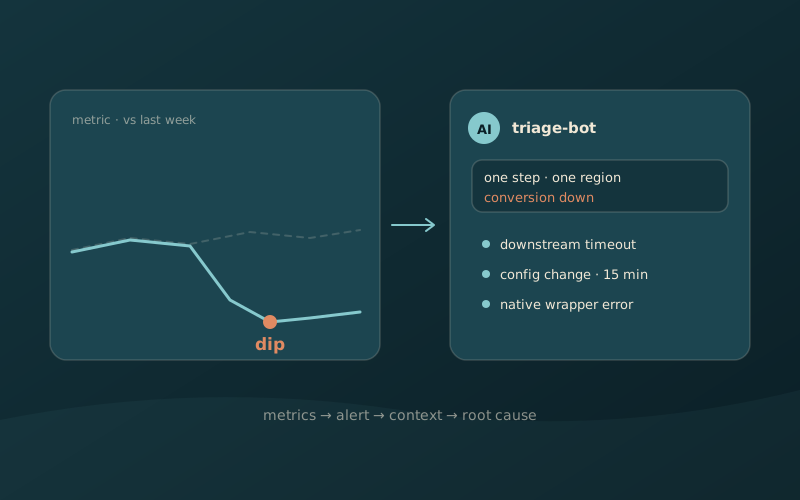
- An alert that arrives with context. When an alert fires it posts an incident card to the team chat. A background worker then gathers recent frontend errors, the active configuration version and deployment logs, and sends them as a structured prompt to an LLM API.
- A summary in the thread. The bot replies with a probable root cause, for example: one step's conversion is down in one region, a null-pointer error sits in a native wrapper, a configuration change went out 15 minutes earlier and a downstream service is timing out.
The result
Time to detect dropped from hours or days to minutes, time to mitigation fell, and the alerts became ones people trust. I also tracked alert signal-to-noise (the share of alerts that map to real incidents) and mean time between failures for frontend modules.
Why this way
A normal alert tells you something broke. Collecting the data automatically and summarizing it closes the gap between a metric and a person understanding it, which is where most of the response time was going.